
Rise of Battery Electric Vehicles

Five Strategic Takeaways for 2026–2029
- Global electric vehicle volume is scaling faster than many regional infrastructure ecosystems can support consistently.
- U.S. market share grows unevenly with large quarterly swings driven by policy and consumer confidence factors.
- Charging access is transitioning from proprietary networks to interoperable connector standards across manufacturers.
- Regulation increasingly emphasizes safety performance alongside emissions targets, particularly for automatic emergency braking systems.
- Software quality and over-the-air update discipline are becoming primary differentiators in the electric vehicle segment.
Market Momentum Versus Maturity
Momentum is measurable: the International Energy Agency reports that global electric car sales grew by 20% in 2025 to exceed 20 million units, meaning roughly one-quarter of all new cars sold globally were electric. This represents a significant acceleration from previous years and demonstrates that battery-electric vehicles have moved beyond early-adopter segments into mainstream consideration.
Maturity is harder to quantify. It is whether battery EVs are supported by robust charging uptime, predictable residual-value behavior, and safety technologies that keep pace with higher curb weights and faster torque response. These operational realities determine whether the market transition is sustainable beyond the reach of purchase incentives and policy mandates.
Cox Automotive's Kelley Blue Book estimates show U.S. new EV sales in calendar year 2025 came in just shy of 2024's 1.30 million, with EVs representing 7.8% of total light-vehicle market volume, down slightly from 8.1% in 2024. That same 2025 data set illustrates how sensitive the market is to policy design and consumer confidence.
EV share peaked at 10.5% in Q3 2025 and then fell to 5.8% in Q4 2025, demonstrating substantial quarter-to-quarter volatility. The competitive shape is also quantifiable: Tesla remained the largest single brand in U.S. EV volume in 2025 with 589,000 units, while General Motors exceeded 150,000 EVs and strengthened its position as the largest non-Tesla EV group.
Two common analytical mistakes still show up in executive discussions. The first is treating charger count as a proxy for charging experience. It is not; the experience is a function of uptime, location coverage, power delivery consistency, and the time it takes a driver to recover from an exception state.
The second mistake is treating incentives as a permanent demand engine. Federal credits and state programs influence timing, but product-market fit increasingly depends on charging confidence and total cost of ownership predictability, not on short-lived policy windows that can shift with administration changes.
A useful way to frame the rise is to separate these two dimensions. Market momentum captures the rate of adoption and sales volume growth. Market maturity captures the depth of supporting infrastructure, the robustness of service ecosystems, and the predictability of ownership experience over multi-year horizons.
For engineering and product strategy teams looking at the 2026–2029 window, the challenge is to design for both dimensions simultaneously: capturing momentum through compelling product features while building the operational foundation for long-term maturity and customer trust in the electric vehicle transition.
Charging Infrastructure at Scale
Moving from port counts to reliability metrics that define real driver experience
The Reliability Challenge
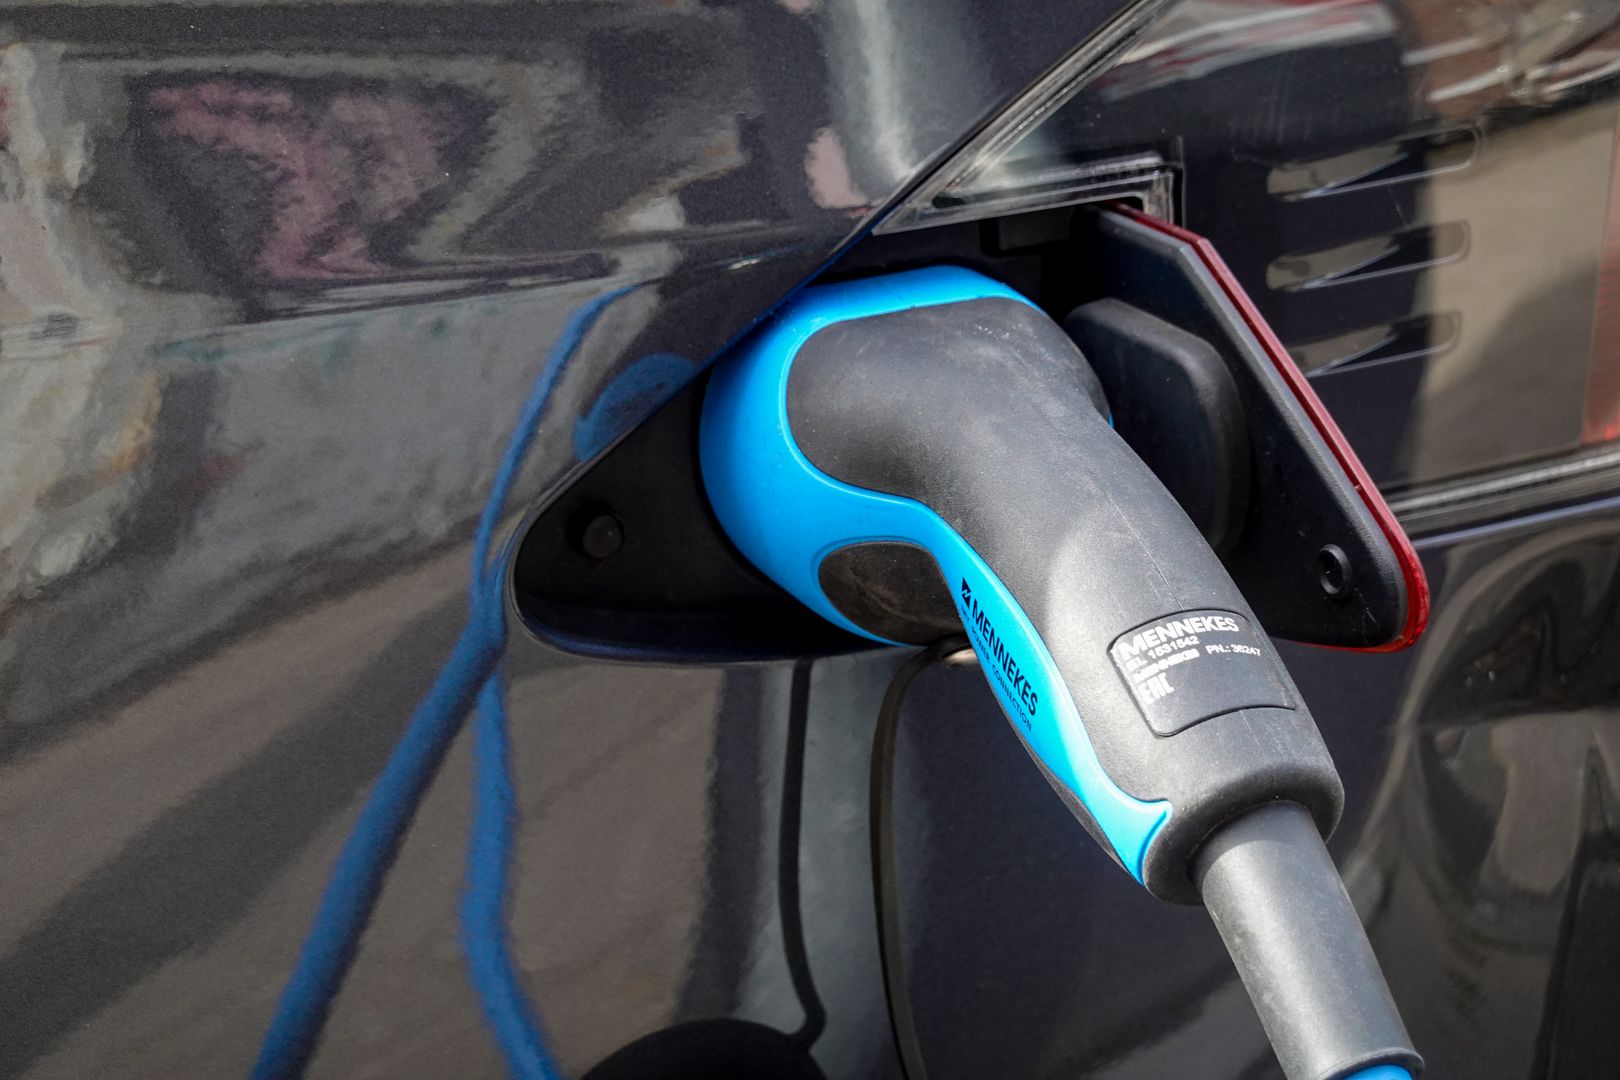
The U.S. public network surpassed 250,000 charging ports by mid-2026, and the most time-critical subset—public DC fast charging—now exceeds 73,000 ports. That scale is meaningful, but professionals should resist the false comfort of totals. What drivers experience is availability at the exact node they need, at the exact time they arrive, with predictable power delivery and transparent session initiation. From a system perspective, this is why reliability metrics, queue prediction, site power-sharing logic, and maintainability—mean time to repair, parts availability, remote reset capability—are now competitive features rather than operational footnotes. Connector convergence is reducing one major friction point. By July 2026, Tesla's own Supercharger access documentation lists a broad set of manufacturers with access to NACS Superchargers, including Ford, General Motors, Rivian, Mercedes-Benz, Hyundai, Kia, Honda, Acura, Nissan, Toyota, Subaru, Volkswagen, Volvo, Polestar, BMW, Audi, Porsche, Lucid, JLR, and Stellantis.
Critical Infrastructure Dimensions
- Uptime and reliability metrics at individual charging nodes
- Queue prediction and site power-sharing logic
- Transparent session initiation and payment experience
- Mean time to repair and parts availability
- Remote diagnostics and reset capability
- Connector standardization and adapter transition management
- Station stall geometry and cable reach constraints
- Performance accountability and data reporting standards
Policy and Safety Regulation
How federal mandates and state adoption shape the operational landscape
Federal and State Frameworks
Public investment is shaping the rollout tempo, but it is most effective when it targets gaps rather than duplicating private deployments. The Federal Highway Administration's National Electric Vehicle Infrastructure Formula Program apportions $5 billion over five years from FY 2022 through FY 2026 to help establish an interconnected fast-charging network along designated corridors.
NEVI requirements push toward standardized payment experience, data reporting, and minimum uptime. For grid operators and charging integrators, NEVI's lasting contribution may be its industrialization effect: forcing repeatable designs, permitting playbooks, and performance accountability into a domain that previously looked like bespoke construction.
The state regulatory mosaic adds another layer of predictability for manufacturers, even if it increases compliance complexity. The U.S. Department of Energy's Alternative Fuels Data Center lists 17 states plus the District of Columbia as having adopted California's Zero-Emission Vehicle standards as of mid-2026.
These states include California, Colorado, Connecticut, Delaware, Maine, Maryland, Massachusetts, Minnesota, Nevada, New Jersey, New Mexico, New York, Oregon, Rhode Island, Vermont, Virginia, and Washington, plus D.C. This matters because ZEV policy is not merely a tailpipe issue; it affects dealer service tooling, workforce certification needs, parts stocking, and the cadence at which regional charging demand will materialize.
Policy is also tightening through a different channel: safety. Automatic brake systems—more precisely, automatic emergency braking with pedestrian AEB—are now on a federal compliance clock. NHTSA's FMVSS No. 127 final rule is effective July 8, 2024, with a compliance date of September 1, 2029 for most manufacturers.
In its regulatory analysis, NHTSA estimates quantifiable benefits of 362 fatalities reduced and 24,321 injuries reduced when the rule is fully deployed. For EV programs, the strategic link is clear: higher average vehicle mass and quieter low-speed operation increase the value of robust crash avoidance.
EV-centric braking-by-wire architectures can either enable superior control—or, if poorly tuned, create customer distrust through false positives and uncomfortable decelerations. From an ADAS engineering perspective, the rise of battery-electric cars intersects with safety in three practical ways.
First, regenerative braking changes the pedal feel and deceleration blending problem: the system must deliver consistent response across battery state-of-charge limits, traction constraints, and friction-brake thermal conditions. Second, sensor suites and compute platforms are being rationalized across nameplates to reduce BOM complexity; that makes software validation and over-the-air update discipline more consequential.
Connector Standardization Progress
By July 2026, connector convergence is reducing one major friction point across the industry. SAE International issued SAE J3400 in December 2023 and revised the recommended practice in September 2024, providing a formal standard for the North American Charging System. For product planners, the operational implication is simple: adapter dependency is a transitional state, but charge-port placement, cable reach, and station stall geometry will remain real-world constraints for years, especially as mixed fleets concentrate around the same high-utilization corridors.
Engineering Execution Levers
The coordinated capabilities that will define the next market phase
Beyond the Breakthrough Narrative
The market's next phase will be decided less by a single breakthrough and more by coordinated execution across a short list of levers: battery supply resilience with cell chemistry optionality and qualified second sources; thermal robustness including heat-pump integration, cold-soak behavior, and fast-charge derating control; charging interoperability with J3400 ecosystem maturity and adapter transition management; uptime engineering covering serviceability, remote diagnostics, and spares logistics; grid integration through managed charging, demand response, and transformer capacity planning; safety performance including AEB and PAEB tuning, brake blending, and post-crash isolation; cybersecurity with secure boot, key management, and backend API hardening; and residual operational friction such as repair cycle time, parts constraints, and training. A more grounded roadmap for organizations aligning product and infrastructure strategy typically progresses through five stages. Stage 1 is basic parity: ensuring the battery electric vehicle meets mainstream expectations for range stability, HVAC performance, and warranty confidence.
Real Disadvantages in 2026
There are real disadvantages that remain material in July 2026. Fast charging is still a thermal and grid-constrained event, not a universal substitute for home or workplace charging. Cold climates still expose efficiency losses and charging-power limits that can surprise first-time drivers who have not experienced winter range degradation firsthand.
Heavier curb weights can accelerate tire wear and stress suspension components if chassis tuning prioritizes headline performance over durability. This trade-off becomes visible over extended ownership periods when replacement costs accumulate faster than traditional internal combustion equivalents in similar vehicle segments.
EV software stacks are now deep enough that quality assurance must match aerospace-like rigor in certain subsystems; the industry is still learning how to do that while shipping frequent feature updates. The tension between rapid iteration and validated safety-critical code remains an active challenge for engineering organizations.
The rise of battery-electric cars is therefore best understood as the rise of an integrated safety-and-energy product. The engineering winners will be the teams that treat charging as a reliability discipline, treat ADAS as a regulated safety function rather than a marketing feature, and treat batteries as lifetime-managed assets rather than a static component.
In practical terms, the companies that can deliver consistent charging access, stable brake feel under blended regen, and demonstrable compliance readiness for AEB and PAEB will convert EV curiosity into durable market share—without relying on narrative momentum alone. This execution discipline separates showcase vehicles from scalable platforms.
Stage 3 is scale economics: platform consolidation, cell sourcing diversification, and manufacturing yield improvements that stabilize margins without quality erosion. Stage 4 is safety and trust at scale: meeting FMVSS No. 127 performance targets, reducing false positives, and proving post-crash high-voltage containment and rescue guidance.
Stage 5 is network intelligence: using fleet telemetry with appropriate privacy controls to predict charging congestion, guide site placement, and tune energy management for both vehicles and chargers. This final stage represents the transition from reactive operations to predictive infrastructure optimization.
Organizations that complete all five stages will be positioned to serve not just early adopters but mainstream buyers who expect electric vehicles to match or exceed the convenience and reliability expectations established by decades of internal combustion vehicle ownership experience across diverse use cases and climate conditions.
Fatal error: Uncaught ValueError: Unknown format specifier "," in /srv/sites/autoglobal-insights/wp-content/themes/trafium-ai/parts/author_box_extended.php:89 Stack trace: #0 /srv/sites/autoglobal-insights/wp-content/themes/trafium-ai/parts/author_box_extended.php(89): sprintf('flex: 0 0 auto;...', 96) #1 /srv/sites/autoglobal-insights/wp-content/themes/trafium-ai/functions.php(434): include('/srv/sites/auto...') #2 /srv/sites/autoglobal-insights/wp-content/themes/trafium-ai/templates/blog-post.php(50): trafium_ai_render_post_block('author_box_exte...', 72, 16) #3 /srv/sites/autoglobal-insights/wp-includes/template-loader.php(106): include('/srv/sites/auto...') #4 /srv/sites/autoglobal-insights/wp-blog-header.php(19): require_once('/srv/sites/auto...') #5 /srv/sites/autoglobal-insights/index.php(17): require('/srv/sites/auto...') #6 {main} thrown in /srv/sites/autoglobal-insights/wp-content/themes/trafium-ai/parts/author_box_extended.php on line 89